A project plan can look perfectly manageable—until deadlines overlap, tasks depend on one another, and no one knows what is supposed to happen next. A Gantt chart helps make that complexity visible. It displays project tasks along a timeline, so you can quickly see when work starts and finishes, which activities overlap, and where delays might affect the schedule.
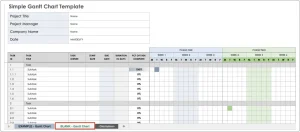 You don’t necessarily need specialized project-management software to build one. Microsoft Excel can create a useful Gantt chart with a task table and a stacked bar chart. This guide explains what a Gantt chart is, how to make one in Excel, how to customize it, and what to keep in mind as your project changes.
What is a Gantt chart?
A Gantt chart is a visual schedule. Tasks appear as rows, and time runs horizontally across the chart. Each task is represented by a bar whose position and length indicate its start date and duration.
A simple chart might track:
| Task | Start date | Duration (days) |
|---|---|---|
| Define project scope | May 4 | 3 |
| Design solution | May 7 | 5 |
| Build prototype | May 12 | 8 |
| Test prototype | May 20 | 4 |
The chart makes it easier to answer questions such as:
- What work is happening this week?
- Which tasks are scheduled at the same time?
- When is a particular task expected to finish?
- Is the project on track?
A Gantt chart can show task timing and, when configured to do so, progress and dependencies. It is not automatically a complete project plan: you still need to define the work, estimates, owners, and relationships between tasks.
Why use Excel for a Gantt chart?
Excel is a practical option when you need a straightforward schedule that is easy to share and adapt. It can be especially useful for small projects, one-off plans, and teams that already use spreadsheets.
Advantages include:
- Familiarity: Many people can update a spreadsheet without learning a new tool.
- Flexibility: You can tailor columns, formulas, and formatting to your project.
- Accessibility: A basic Gantt chart can be made with standard Excel chart features.
- Convenient sharing: Workbooks can be shared or stored using Microsoft 365 tools.
There are trade-offs. A manually maintained spreadsheet can become difficult to manage when a project has many tasks, frequent schedule changes, complex dependencies, or detailed resource requirements. For larger projects, dedicated project-management software may offer more robust scheduling and collaboration features.
Before you start: organize your project data
A clear source table makes the chart easier to create and maintain. At a minimum, include:
- Task: A short, specific activity name.
- Start date: The date work is scheduled to begin.
- Duration: The planned length of the task.
- Owner: The person or team responsible, if relevant.
- Status or percent complete: Useful for tracking progress.
- Predecessor: The task or tasks that must happen first, if relevant.
For a simple chart, you can calculate the finish date with a formula. If the start date is in B2 and duration in days is in C2, an inclusive calendar-day finish date can be calculated as:
=B2+C2-1
The -1 matters because a one-day task that starts on May 4 finishes on May 4, not May 5.
This formula counts calendar days. If you need to exclude weekends, Excel’s WORKDAY function can calculate a finish date based on working days. For example:
=WORKDAY(B2,C2-1)
You can also provide a holiday range as an optional third argument. Microsoft documents WORKDAY as a function for calculating a date before or after a specified number of working days.[1]
How to create a basic Gantt chart in Excel
The most common Excel method uses a stacked bar chart. One data series positions each task along the timeline; a second series draws the visible task bar.
1. Set up the data
Arrange the columns like this:
| Task | Start date | Duration |
|---|---|---|
| Define project scope | May 4, 2026 | 3 |
| Design solution | May 7, 2026 | 5 |
| Build prototype | May 12, 2026 | 8 |
| Test prototype | May 20, 2026 | 4 |
Use real Excel date values in the Start date column, not text that merely looks like a date. In the Duration column, use numbers representing the units you intend the chart to show—calendar days, for example.
2. Insert a stacked bar chart
- Select the Start date and Duration data, including their headers.
- Choose Insert → Insert Column or Bar Chart.
- Select Stacked Bar.
A standard stacked bar chart may not initially include the task names. You can add them as category labels:
- Right-click the chart and choose Select Data.
- Under the category-axis labels, choose Edit.
- Select the cells containing the task names.
Excel’s chart tools allow you to adjust the chart’s data series and category labels through the Select Data interface.[2]
3. Put the earliest task at the top
Excel may place the first task at the bottom of the chart. To reverse the order:
- Right-click the task-name axis.
- Select Format Axis.
- Under Axis Options, enable Categories in reverse order.
The exact wording or location can vary slightly by Excel version.
4. Hide the start-date bars
The first series—the start date—serves as an invisible offset. It pushes each duration bar to the correct place on the timeline.
- Select one of the Start date bars.
- Open Format Data Series.
- Set Fill to No fill and Border to No line.
The remaining visible bars represent task durations. This use of a hidden first series is the standard stacked-bar approach to building a Gantt-style chart in Excel.[3]
5. Format the timeline
The horizontal axis may initially display large date serial numbers or an overly broad range. To tidy it up:
- Right-click the horizontal date axis and choose Format Axis.
- Set the minimum and maximum bounds to suit the project’s start and finish dates.
- Adjust the major unit—for example, to show weekly intervals.
- Choose a date number format that is easy to read.
If Excel displays unexpected dates, check that the start-date cells contain valid date values and that the axis is formatted as dates.
6. Add a title and clean up the layout
Give the chart a descriptive title, such as Website Launch Schedule. You may also want to:
- Remove the legend if it adds no useful information.
- Widen the chart so task names and dates are readable.
- Use light gridlines to help viewers estimate dates.
- Choose consistent colors and avoid excessive decoration.
- Add a note explaining whether durations mean calendar days or working days.
Track progress and milestones
A schedule becomes more informative when it distinguishes planned work from completed work.
Show percent complete
Add a % Complete column to the task table. One option is to use a separate progress series or a second bar layered over each task’s planned duration. This can be done, but it takes extra chart formatting and may be harder to maintain.
For a simpler approach, use conditional formatting in the source table, or add a status column with values such as Not started, In progress, and Complete. A color-coded table paired with the Gantt chart can be easier to maintain than a highly customized chart.
Be clear about what “complete” means. A task marked 80% complete based on elapsed time may not actually have delivered 80% of its work.
Mark milestones
A milestone is a significant point in the project, such as approval, delivery, or launch. It typically has zero duration. Since zero-length tasks may not appear as visible bars in a stacked chart, you can represent milestones with a separate marker or a distinct symbol placed at the relevant date.
Label milestone markers directly where possible. If the chart has many tasks, a separate milestone table can be clearer than trying to fit every label into the plot.
Dependencies: what a basic chart does—and does not—show
A task dependency describes a relationship between tasks. For example, testing may not begin until the prototype is built. A basic Excel Gantt chart shows task dates, but it does not automatically enforce that relationship. If the build date shifts, you may need to adjust the testing date yourself.
You can make dependencies more visible by adding a Predecessor column to your project table. For a small plan, that may be enough to prompt manual review. More complex charts can use connector lines, but these can be fiddly to build and maintain in Excel.
If your schedule depends on frequent changes, multiple dependency types, or automatic rescheduling, consider whether a dedicated scheduling tool would be a better fit.
Common problems and how to fix them
The task bars appear as columns or look squashed
Make sure you selected Stacked Bar, not a clustered bar or column chart. Also check the axis bounds and the chart’s size.
The task names appear in the wrong order
Use Categories in reverse order on the vertical category axis. You may also need to adjust where the horizontal axis crosses the category axis.
The bars start far from the beginning of the chart
That is expected when the timeline begins at Excel’s default axis minimum. Set the horizontal axis’s minimum bound to the project start date or a suitable date shortly before it.
The bars do not line up with the intended dates
Check that the Start date cells are true date values, not text. Confirm that the chart uses the correct data ranges and that the duration units match your expectations.
The chart becomes hard to read
Reduce unnecessary gridlines and labels, group or filter tasks, and limit the number of colors. If the project has many tasks, consider splitting the plan into phases or creating separate views for different teams.
Tips for keeping your Gantt chart useful
- Break work into meaningful tasks. Tasks that are too broad hide important detail; tasks that are too small create maintenance overhead.
- Keep the schedule current. A chart is only helpful if its dates reflect the latest plan.
- Separate estimates from commitments. Label tentative dates clearly rather than presenting them as firm deadlines.
- Include owners. A schedule is easier to act on when responsibilities are visible.
- Use working-day logic when appropriate. Calendar-day durations can misrepresent schedules that pause on weekends or holidays.
- Protect formulas where useful. If multiple people will edit the workbook, consider protecting formula cells while leaving input cells editable.
- Check readability before sharing. Verify that dates, task names, and status indicators remain clear when printed or viewed on a smaller screen.
Conclusion
A Gantt chart in Excel can turn a task list into a clear project timeline. With a task table, start dates, durations, and a stacked bar chart, you can see when work is planned and how activities overlap. Add owners, progress, milestones, and dependency information when they help people make better decisions—but avoid adding so much detail that the chart becomes difficult to read or update.
For a small or moderately simple project, Excel offers a flexible and familiar way to build a useful schedule. For complex plans that require automatic rescheduling, extensive dependency management, or coordinated resource planning, a dedicated project-management tool may be more appropriate.
Sources
- Microsoft Support, “WORKDAY function.”
- Microsoft Support, “Change the data series in a chart.”
- Microsoft Create, “Create a Gantt chart in Excel.)”